TABLE OF CONTENTS
Introduction
This OpenSRP Module/app provides Growth Monitoring (Weight, Height) recording, updating, editing and charting capabilities. It also provides the z-score of a patient from their Growth Monitoring (Weight, Height).
Features
The app has the following features:
- It enables one to record the current or past Growth Monitoring (Weight, Height)
- It enables one to edit a patient's Growth Monitoring (Weight, Height) record
- It enables one to view the patient's Growth Monitoring (Weight, Height) over time on a graph
- It enables one to view the z-score
- It enables one to determine a patient's Growth Monitoring (Weight, Height) status from the z-score
Z-Score
The z-score is a score calculated from the Growth Monitoring (Weight, Height) & age of a patient to determine their Growth Monitoring (Weight, Height) status i.e. overweight, underweight, average Growth Monitoring (Weight, Height) ...
This score is calculated using values provided by WHO.
Z-score color codes
| Color | Meaning | Appropriate Z-score |
|---|---|---|
| Red | Underweight/Overweight | -2 and above OR +2 and above |
| Green | Good! |
Between -2 and +2 |
| Dark Blue | Dangerous Growth Monitoring (Weight, Height) | Over +3 or below -3 |
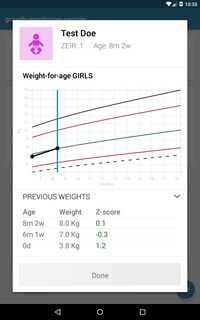
You can easily tell the Growth Monitoring (Weight, Height) status by checking the z-score line on the graph and where it falls within the z-score indicators. The z-score line indicators use the same color-codes above
App Walkthrough
The app is easy to use and has five important screens
- When you open the app, the following page is displayed.
-
The Top Section has two buttons:
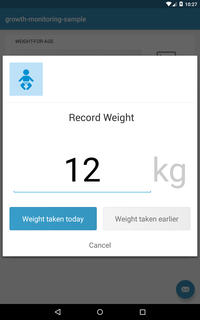
- Record Weight Button which enables one to record
currentorpast Growth Monitoring (Weight, Height)
- Weight Graph Button which displays a dialog with the patient's weight-for-age, height-for-age and weight-for-height z-scores plotted in a line graph, (depending on the provided app configurations in the properties file). The specific values are also displayed below the graph. See below screenshot for a weigh-for-age graph.

- Record Weight Button which enables one to record
-
The Bottom Section displays the last 5 Growth Monitoring (Weight, Height)s recorded in the patient's lifetime.
Configuring charts
By default the library displays the Weight-For-Age graph but for the other 2 charts, that is the Height-For-Age and Weight-For-Height charts, you MUST provide configurations in the app.properties file. Use the following configs to achieve this:
monitor.height=true
monitor.weight.for.height=true
Developer Documentation
This section will provide a brief description how to build and install the application from the repository source code.
Pre-requisites
- Make sure you have Java 1.7 to 1.8 installed
- Make sure you have Android Studio installed or download it from here
Installation Devices
- Use a physical Android device to run the app
- Use the Android Emulator that comes with the Android Studio installation (Slow & not advisable)
- Use Genymotion Android Emulator
- Go here and register for genymotion account if none. Free accounts have limitations which are not counter-productive
- Download your OS Version of VirtualBox at here
- Install VirtualBox
- Download Genymotion & Install it
- Sign in to the genymotion app
- Create a new Genymotion Virtual Device
- Preferrable & Stable Choice - API 22(Android 5.1.0), Screen size of around 800 X 1280, 1024 MB Memory --> eg. Google Nexus 7, Google Nexus 5
How to install
- Import the project into Android Studio by: Import a gradle project option All the plugins required are explicitly stated, therefore it can work with any Android Studio version - Just enable it to download any packages not available offline
- Open Genymotion and Run the Virtual Device created previously.
- Run the app on Android Studio and chose the Genymotion Emulator as the
Deployment Target


