chartjs-plugin-stacked100
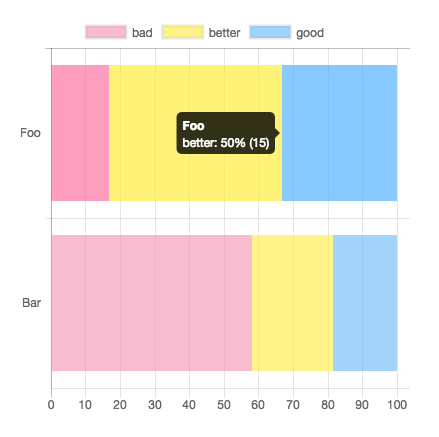
This plugin for Chart.js that makes your bar chart to 100% stacked bar chart.
Demo: https://y-takey.github.io/chartjs-plugin-stacked100
Installation
npm install chartjs-plugin-stacked100 --save
Usage
Basic
specify plugin options with { stacked100: { enable: true } }.
Use your tooltip label
specify plugin options with { stacked100: { enable: true, replaceTooltipLabel: false } }. and you can pass tooltip option.
new Chart(document.getElementById("my-chart"), {
  type: "bar",
  data: {},
  options: {
    tooltips: {
      callbacks: {
        label: (tooltipItem, data) => {
          const datasetIndex = tooltipItem.datasetIndex;
          const datasetLabel = data.datasets[datasetIndex].label;
          // You can use two type values.
          // `data.originalData` is raw values,
          // `data.calculatedData` is percentage values, e.g. 20.5 (The total value is 100.0)
          const originalValue = data.originalData[datasetIndex][tooltipItem.index];
          const rateValue = data.calculatedData[datasetIndex][tooltipItem.index];
          return `${datasetLabel}: ${rateValue}% (raw ${originalValue})`;
        }
      }
    },
    plugins: {
      stacked100: { enable: true, replaceTooltipLabel: false }
    }
  }
});
Specify the precision of the percentage value
You can pass precision option. (default value is 1 ) For example, when you pass { stacked100: { enable: true, precision: 3 } }, the result is 0.123% .
Examples
new Chart(document.getElementById("my-chart"), {
  type: "horizontalBar",
  data: {
    labels: ["Foo", "Bar"],
    datasets: [
      { label: "bad", data: [5, 25], backgroundColor: "rgba(244, 143, 177, 0.6)" },
      { label: "better", data: [15, 10], backgroundColor: "rgba(255, 235, 59, 0.6)" },
      { label: "good", data: [10, 8], backgroundColor: "rgba(100, 181, 246, 0.6)" }
    ]
  },
  options: {
    plugins: {
      stacked100: { enable: true }
    }
  }
});
Datapoints can be Objects
...
// line or bar charts
datasets: [
  { data: [{ y: 5 }, { y: 25 }] },
  { data: [{ y: 15 }, { y: 10 }] },
  { data: [{ y: 10 }, { y: 8 }] }
]

// horizontalBar charts
datasets: [
  { data: [{ x: 5 }, { x: 25 }] },
  { data: [{ x: 15 }, { x: 10 }] },
  { data: [{ x: 10 }, { x: 8 }] }
]
...
How to use datalabels plugin
new Chart(document.getElementById("my-chart"), {
  type: "horizontalBar",
  data: {},
  options: {
    plugins: {
      datalabels: {
        formatter: (_value, context) => {
          const data = context.chart.data;
          const { datasetIndex, dataIndex } = context;
          return `${data.calculatedData[datasetIndex][dataIndex]}% (${data.originalData[datasetIndex][dataIndex]})`;
        }
      },
      stacked100: { enable: true }
    }
  }
});
Supported chart types
- bar
- horizontalBar
- line (via @HoJSim, thanks!)
Contributing
Pull requests and issues are always welcome.
For bugs and feature requests, please create an issue.
- Fork it!
- Create your feature branch:
git checkout -b my-new-feature - Commit your changes:
git commit -am 'Add some feature' - Push to the branch:
git push origin my-new-feature - Submit a pull request!
